How to Build a Financial Close Process Flowchart

Technology helps teams efficiently close the books, prepare year-end financial reports faster and even transform the way the whole financial close process works. But how can you build a business case to persuade managers to procure that technology?
Based on my experience, it is best to start by auditing the entire financial close process, determining where technology fits into the workflow and demonstrating what challenges it will help you overcome. Performing this work upfront will shed light on inefficiency in its many forms—ranging from lost hours to restatements—and show the impact on the bottom line.
I have found that there are five primary steps teams can take to implement financial close process improvements and simplify financial close reporting:
- Step 1: Create a process flowchart
- Step 2: Identify risks and opportunities
- Step 3: Find systems and tools for improvement
- Step 4: Implement process change
- Step 5: Continuously improve
We will explore each step in this blog series, starting with how to create a flowchart for your financial close.
What is a process flowchart?
Also known as a process map, a process flowchart is a step-by-step visual representation of a specific process. The process flowchart should provide an easy-to-follow record of how the organisation works to accomplish a given task and clearly show the handoff between different process owners.
Why should you map your process?
The top reason to create a process flowchart is to give everyone a shared understanding of how the process works from start to finish. It helps establish timing and expectations of each party in what has become a complex undertaking. It also reinforces your knowledge of what happens in each step. From there, you can use your map to identify areas of potential risk and areas ripe for improvement.
Who should draft the process flowchart?
Process mapping can include the process owners themselves, internal and external consultants and auditors. Those directly involved in the financial close process should be involved in drafting and reviewing the flowchart. This helps ensure buy-in from all stakeholders.
What should a process flowchart include?
If you look at process flowchart examples, you will find they all include some common details:
- Timing/schedules: Include the time frames needed to complete certain tasks to stay on schedule and meet reporting deadlines
- Roles and team members: Indicate what functions and teams or departments are involved in the financial close
- Systems/tools: Identify the tools or programs used in each step, from ERPs to CRMs to HCMs or PC-based applications, for example
- Business units, regions, lines of business: Provide a holistic view of financial close processes from across the enterprise
What does a financial close process flowchart look like?
I am a process-focused individual. When I think about building a flowchart for the financial close, I focus on the final stage of the financial close process. This is what follows after the accounting close, when organisations analyse performance and summarise results for required disclosures, regulatory reports or presentations to the board, investors and other stakeholders.
Why do I focus so much on this phase? The final stage is usually the most manual and least documented of all stages, making it not only filled with risk but best suited for improvement. The outputs from this stage are also the most visible, as they are what you ultimately share with decision-makers and regulators.
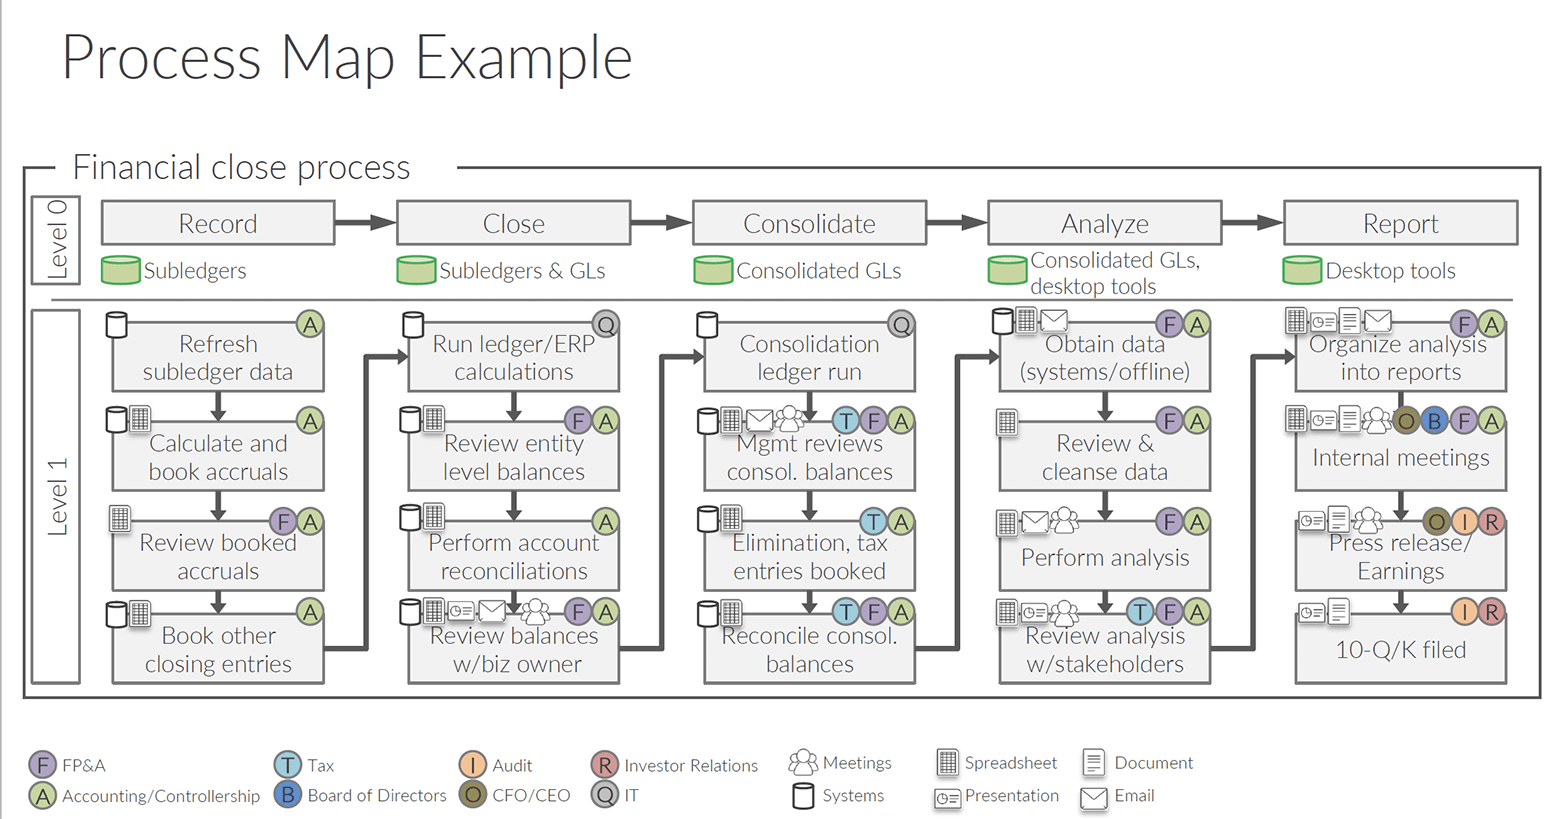
Here is one example of a high-level process map for the financial close that you can use as a template:

As you can see, this example illustrates many different components of the process, including:
- Steps in the process (with directional arrows showing the workflow)
- The departments of the people involved (indicated in the circles)
- Applications or systems that are used (represented by the icons)
For this example, I did not include names of specific individuals, but your organisation might find that information useful to include.
Helpful hints
I drew my process flowchart in Wdesk, which gives collaborators a connected environment where they can securely share and work on documents together in the cloud, add comments, see everyone's responses and track revisions over time. Whatever program you choose to build your flowchart, be sure to give your teammates a convenient method to share comments and revisions. You may also want to store a copy of each revision, labelled by date, that you can easily refer to as your process evolves. I hope this information is enough to help you start drafting your first financial close process flowchart. For more tips and tricks, you can check out the 5 Steps to Simplify Your Financial Close and Reporting Process webinar.
Don’t wait! Register for a free Amplify account and stream select sessions until Oct. 31, 2023. Explore how financial reporting, ESG, and GRC intersect.
Management Reporting Datasheet
Learn how to create internal reports that drive decision-making.


